What’s wrong with GA4, or how to find essential reports in Google Analytics


Google Analytics 4 (GA4) reporting has received some criticism and feedback from users since its release. Here is the list of main differences between GA4 and Universal Analytics (GA3):
- Interface Redesign: GA4 offers a more streamlined interface compared to GA3.
- Navigation: GA4's navigation is organized into sections like "Realtime", "Audience", "Acquisition", "Behavior", and "Conversions".
- Visualization: GA4 introduces updated chart types and interactive visualization options.
- Audience Insights: GA4 adds metrics like Engagement Rate and Active Users for deeper audience understanding.
- Acquisition Analysis: GA4 provides enhanced attribution modelling and campaign performance insights.
- Behaviour Tracking: GA4's behaviour reports include new metrics and insights like user engagement and retention.
- Conversion Analysis: GA4's conversion reports offer more comprehensive tracking of key metrics and revenue.
Despite GA4 offering an array of reporting tools, users may face confusion regarding the location of certain reports or the type of data in the interface. In this article, we delve into common reporting queries and where to locate them in GA4.
Case 1: Identifying Popular Content Pages
The Engagement → Pages and Screens report in GA4 is the go-to for understanding page views. However, filtering data for specific page types, like product or news pages, may be unclear. That`s where the Report filter comes in handy.
To filter data, follow these steps:
- Click on the ‘Customize report' pencil icon.
- In the sidebar, navigate to the Report filter block and click ‘Add filter’.
- Select the dimension for filtering, such as 'Page path and screen', and set the filter criteria (e.g., contains 'blog' or 'products').
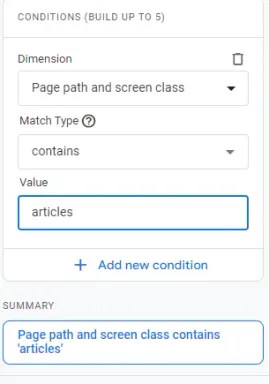
setting up the Report filter in GA4
And that's it! Press Apply and the bottom of the sidebar, and you get your filtered page data report.
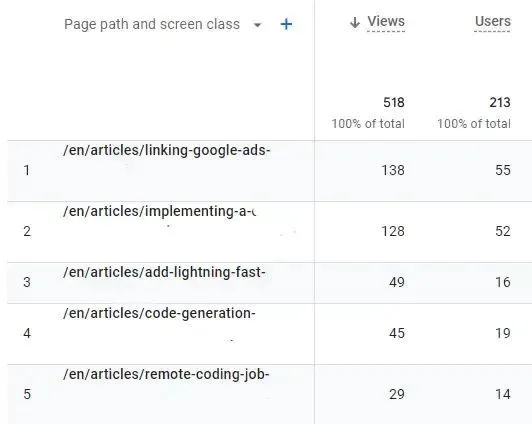
The report contains only article pages' data
Case 2: Analyzing Unique and Total Page Views
In the Engagement → Pages and Screens report, the Users column provides unique user counts, while the Views column offers total page views. Utilize the Search field to find data for specific pages.
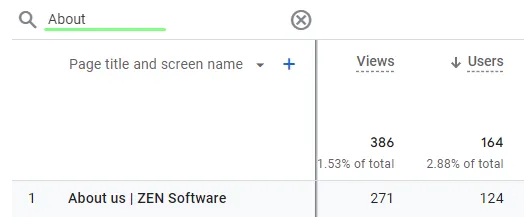
searching for data on the About page
Case 3. Understanding Traffic Sources
The Traffic Acquisition report under the Engagement menu tab offers insights into traffic sources.
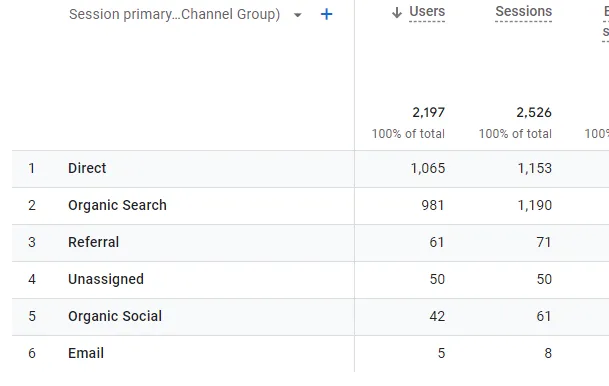
Default Traffic acquisition report
Customize the report by switching from the default view to 'Session source/medium' for clearer insights. Utilize UTM tags to customize the source and medium parameters further
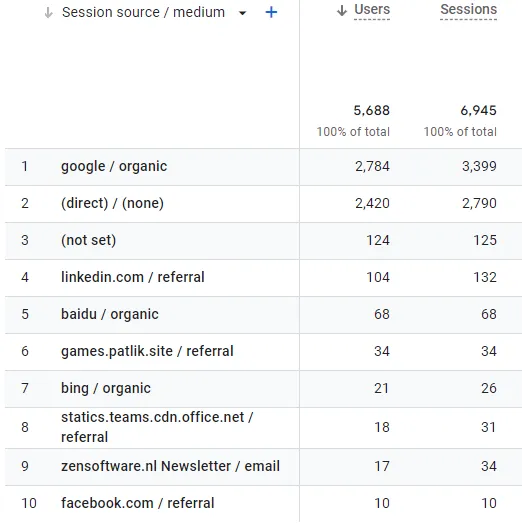
There you can see traffic sources much clearer. You can also customise your source and medium parameters by using UTM tags. It`ll allow you to get even more traffic information and shape its form to your demand.
Conclusion
While Google Analytics 4 (GA4) offers powerful website performance insights and great improvements, navigating its interface may pose challenges. Experimenting with filters and alternate report tables can unveil new insights without the need for additional tools.
Unlock the full potential of your digital presence with expert guidance on Google Analytics 4! Our seasoned specialists are ready to optimize your data tracking, interpret insights, and drive informed decisions. Elevate your analytics game today - schedule a consultation with our experts!

Lightning-Fast Site, Awesome Conversion
Deliver content worldwide with a site that never slows down. Forget the WordPress or Magento delays—fast, safe, and cloud-based!
Read more:

What’s wrong with GA4, or how to find essential reports in Google Analytics
Google Analytics 4 (GA4) reporting has received some criticism and feedback from users since its release. Despite GA4 of...

Linking Google Ads and Google Analytics 4 (GA4) to your Next.js site
When releasing Agile Analytics we struggled linking Google Ads to Google Analytics v4 to our fine ReactJS site. Here is ...

A Developer's Guide to Agile Rollouts: adding Feature Flags in React
**Feature flags**, also known as **feature toggles** or **feature switches**, are a powerful tool in software developmen...

Remote Coding Job Interviews are DEAD because of Nvidia and ChatGPT
With the rise of remote work, remote coding job interviews have become increasingly popular. However, this shift has bro...

Add lightning fast search to your React/Nextjs site
Creating a search feature on your website can significantly improve the user experience. A well-designed search bar can ...

At least 30 WordPress plugins infected with malware; more sites are considering migration
In recent years, the security of WordPress has come under scrutiny due to several high-profile vulnerabilities and attac...